
Key facts
- 52-week range (closes)
- $46.41 – $67.76 Lowest close Nov 10, 2025, highest Feb 10, 2026; 251 daily closes to Oct 13, 2026 from Dalsna Finance's price archive
- Fiscal year ends
- December Fiscal 2025 ended Dec 31, 2025, from SEC filings
- In the S&P 500 since
- Oct 31, 1984 · All S&P 500 changes
Ball Corporation (BALL) is trading up at $64.16 (+0.50%) on NYSE/NASDAQ, as of the latest quote. It is a S&P 500 constituent in the Materials sector.
Ball Corporation revenue & net income history (FY2016–FY2025)
| FY2016Dec 2016 | FY2017Dec 2017 | FY2018Dec 2018 | FY2019Dec 2019 | FY2020Dec 2020 | FY2021Dec 2021 | FY2022Dec 2022 | FY2023Dec 2023 | FY2024Dec 2024 | FY2025Dec 2025 | |
|---|---|---|---|---|---|---|---|---|---|---|
| Income statement | ||||||||||
| Revenue | $9.06B | $11.0B | $11.6B | $11.5B | $11.8B | $13.8B | $13.4B | $12.1B | $11.8B | $13.2B |
| Growth (year over year) | +13.3% | +21.2% | +5.9% | −1.4% | +2.7% | +17.2% | −3.2% | −9.8% | −2.2% | +11.6% |
| Gross profit | $1.42B | $1.76B | $1.80B | $1.77B | $2.46B | $2.73B | $2.25B | $2.31B | $2.44B | $2.58B |
| Gross margin | 15.7% | 16.0% | 15.5% | 15.5% | 20.9% | 19.7% | 16.8% | 19.1% | 20.7% | 19.6% |
| Operating income | $463.0M | $802.0M | $935.0M | $932.0M | $1.00B | $1.29B | $1.21B | $1.27B | — | — |
| Operating margin | 5.1% | 7.3% | 8.0% | 8.1% | 8.5% | 9.3% | 9.1% | 10.6% | — | — |
| Net income | $263.0M | $374.0M | $454.0M | $566.0M | $585.0M | $878.0M | $719.0M | $707.0M | $4.01B | $912.0M |
| Net margin | 2.9% | 3.4% | 3.9% | 4.9% | 5.0% | 6.4% | 5.4% | 5.9% | 34.0% | 6.9% |
| EPS (diluted) | $0.81 | $1.05 | $1.29 | $1.66 | $1.76 | $2.65 | $2.25 | $2.23 | $13.00 | $3.30 |
| Balance sheet | ||||||||||
| Cash and equivalents | $597.0M | $448.0M | $721.0M | $1.80B | $1.37B | $563.0M | $548.0M | $695.0M | $885.0M | $1.21B |
| Total assets | $16.2B | $17.2B | $16.6B | $17.4B | $18.3B | $19.7B | $19.9B | $19.3B | $17.6B | $19.5B |
| Total liabilities | $12.6B | $13.1B | $13.0B | $14.3B | $14.9B | $16.0B | $16.4B | $15.5B | $11.7B | $14.1B |
| Long-term debt | $7.31B | $6.52B | $6.51B | $6.34B | $7.78B | $7.72B | $7.54B | $7.50B | $5.31B | $6.99B |
| Shareholders' equity | $3.44B | $3.94B | $3.46B | $2.95B | $3.27B | $3.63B | $3.46B | $3.77B | $5.86B | $5.42B |
| Cash flow | ||||||||||
| Operating cash flow | $193.0M | $1.48B | $1.57B | $1.55B | $1.43B | $1.76B | $301.0M | $1.86B | $115.0M | $1.26B |
| Capital expenditure | $606.0M | $556.0M | $816.0M | $598.0M | $1.11B | $1.73B | $1.65B | $1.04B | $484.0M | $474.0M |
| Free cash flow | −$413.0M | $922.0M | $750.0M | $950.0M | $319.0M | $34.0M | −$1.35B | $818.0M | −$369.0M | $788.0M |
| Dividends paid | $83.0M | $129.0M | $137.0M | $182.0M | $198.0M | $229.0M | $254.0M | $252.0M | $244.0M | $220.0M |
| Share buybacks | $107.0M | $103.0M | $739.0M | $964.0M | $57.0M | $766.0M | $618.0M | $3.00M | $1.71B | $1.32B |
| Q3 FY24Sep 2024 | Q4 FY24†Dec 2024 | Q1 FY25Mar 2025 | Q2 FY25Jun 2025 | Q3 FY25Sep 2025 | Q4 FY25†Dec 2025 | Q1 FY26Mar 2026 | Q2 FY26Jun 2026 | |
|---|---|---|---|---|---|---|---|---|
| Income statement | ||||||||
| Revenue | $3.08B | $2.88B | $3.10B | $3.34B | $3.38B | $3.35B | $3.60B | $4.00B |
| Growth (year over year) | −0.9% | −0.8% | +7.8% | +12.8% | +9.6% | +16.2% | +16.3% | +19.7% |
| Gross profit | $545.0M | $930.0M | $604.0M | $648.0M | $678.0M | $648.0M | $646.0M | $697.0M |
| Gross margin | 17.7% | 32.3% | 19.5% | 19.4% | 20.1% | 19.4% | 17.9% | 17.4% |
| Net income | $197.0M | −$32.0M | $179.0M | $212.0M | $321.0M | $200.0M | $205.0M | $221.0M |
| Net margin | 6.4% | −1.1% | 5.8% | 6.4% | 9.5% | 6.0% | 5.7% | 5.5% |
| EPS (diluted) | $0.65 | $0.23 | $0.63 | $0.76 | $1.18 | $0.73 | $0.77 | $0.83 |
| Balance sheet | ||||||||
| Cash and equivalents | $1.44B | $885.0M | $449.0M | $296.0M | $568.0M | $1.21B | $730.0M | $491.0M |
| Total assets | $18.8B | $17.6B | $18.0B | $18.6B | $18.7B | $19.5B | $19.8B | $20.1B |
| Total liabilities | $12.1B | $11.7B | $12.5B | $13.3B | $13.3B | $14.1B | $14.2B | $14.3B |
| Long-term debt | $5.35B | $5.31B | $6.13B | $6.48B | $6.86B | $6.99B | $7.02B | $6.53B |
| Shareholders' equity | $6.68B | $5.86B | $5.50B | $5.21B | $5.45B | $5.42B | $5.60B | $5.75B |
| Cash flow | ||||||||
| Operating cash flow | $610.0M | $500.0M | −$665.0M | $332.0M | $384.0M | $1.21B | −$777.0M | $608.0M |
| Capital expenditure | $117.0M | $107.0M | $81.0M | $96.0M | $127.0M | $170.0M | $161.0M | $141.0M |
| Free cash flow | $493.0M | $393.0M | −$746.0M | $236.0M | $257.0M | $1.04B | −$938.0M | $467.0M |
| Dividends paid | $60.0M | $59.0M | $57.0M | $55.0M | $54.0M | $54.0M | $54.0M | $53.0M |
| Share buybacks | $396.0M | $651.0M | $555.0M | $467.0M | $84.0M | $215.0M | $1.00M | $114.0M |
From Ball Corporation's 10-K and 10-Q filings with the SEC; its fiscal year ends in December. Each period shows the latest figure the company has reported for it, including restatements. Net margin is our own calculation from those reported figures (net income ÷ revenue); it is left blank where revenue is zero or missing. † Quarter derived from the company's year-to-date or full-year totals. Filings on SEC EDGAR →
Ball Corporation vs the Materials sector and the S&P 500
Ball Corporation's latest reported figures next to the median of the other 24 S&P 500 Materials companies and of the other 502 S&P 500 companies; each median is taken over the companies with a comparable figure (counts in the footnote). A median is the middle value, not an average, so one very large company does not move it.
| Measure | Ball Corporation | Materials (24 other S&P 500 companies) | S&P 500 (502 other companies) |
|---|---|---|---|
| Revenue growth, latest fiscal year | +11.6% | +3.3% | +7.0% |
| Net margin, latest fiscal year | 6.9% | 7.1% | 13.0% |
| Dividend per share, latest fiscal year | $0.80 | $2.21 | $2.40 |
| Share price change, 1 year | +31.7% | +11.1% | +7.5% |
Ball Corporation: fiscal year ended December 2025, from its 10-K and 10-Q filings with the SEC. Medians computed October 20, 2026 from each company's latest annual filing (fiscal years ending between July 2025 and September 2026) and our price archive. Prices for every company, Ball Corporation included, are the last regular-session prices of October 20, 2026; the 1-year change compares that price with each company's last close on or before October 20, 2025. Net margin and price change are our calculations from reported figures. Each median counts only the companies with a comparable figure (sector / S&P 500): revenue growth 24/496, net margin 24/496, dividend per share 23/349, 1-year price change 24/488; the reasons below can overlap. 14 are left out of the price figure because our archive holds no comparable close for them; dividend medians are among the 23 sector and 349 S&P 500 companies reporting a per-share dividend. The S&P 500 price figure is the middle company's change, not the index's return.
About Ball Corporation
Ball Corporation is an American aluminum manufacturing company headquartered in Westminster, Colorado, United States. It is best known for its early production of glass jars, lids, and related products used for home canning. Since its founding in Buffalo, New York, in 1880, when it was known as the Wooden Jacket Can Company, the Ball company has expanded and diversified into other business ventures, including aerospace technology. It eventually became the world's largest manufacturer of recyclable aluminum packaging for a variety of beverage, home and personal care applications.
Source: Wikipedia — Ball Corporation
- Headquarters
- Westminster, Colorado From SEC filings, Oct 2026
Recent News (2)
-
Sabato's Crystal Ball moves nearly 3 dozen House races in Democrats favor Nonpartisan election forecaster Sabato’s Crystal Ball is moving 28 House races in Democrats’ direction with just two weeks until the midterms. When adding up the seats Crystal Ball says are either saf…
-
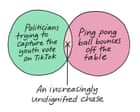 From politicians on TikTok to fetching a ping-pong ball: Edith Pritchett’s week in Venn diagrams – cartoon
Continue reading...
More Materials stocks
- ALB Albemarle Corporation
- AMCR Amcor
- APD Air Products
- AVY Avery Dennison
- CF CF Industries
- CRH CRH plc
- DD DuPont
- DOW Dow Inc.