JFrog (FROG) is trading down at $93.46 (-2.95%), as of the latest quote. It is a Russell 2000 constituent in the Information Technology sector.
Analyst price targets on FROG
One firm's current price target on JFrog: $100 — 7% above the current $93.5. Each is tracked to its date and scored the same way a member's call is.
- Morgan Stanley $89.5 → $100 by Aug 2027 Aug 7, 2026 via Investing.com · Morgan Stanley's track record
Targets published by research firms, extracted from the news, checked against independent reporting, and linked to their source. Where a firm did not state a horizon the target is tracked as 12 months, the industry convention; the rows where the firm set its own horizon are marked. Reported here as facts about what was published — not recommendations from Dalsna Finance, and no firm listed is affiliated with this site.
JFrog revenue & net income history (FY2018–FY2025)
| FY2018Dec 2018 | FY2019Dec 2019 | FY2020Dec 2020 | FY2021Dec 2021 | FY2022Dec 2022 | FY2023Dec 2023 | FY2024Dec 2024 | FY2025Dec 2025 | |
|---|---|---|---|---|---|---|---|---|
| Income statement | ||||||||
| Revenue | $63.5M | $104.7M | $150.8M | $206.7M | $280.0M | $349.9M | $428.5M | $531.8M |
| Growth (year over year) | — | +64.8% | +44.0% | +37.0% | +35.5% | +24.9% | +22.5% | +24.1% |
| Gross profit | $52.8M | $84.7M | $122.4M | $164.9M | $217.8M | $272.8M | $330.2M | $408.4M |
| Gross margin | 83.1% | 80.9% | 81.1% | 79.8% | 77.8% | 78.0% | 77.1% | 76.8% |
| Operating income | −$26.9M | −$6.94M | −$14.2M | −$68.4M | −$89.8M | −$75.5M | −$91.1M | −$91.9M |
| Operating margin | −42.3% | −6.6% | −9.4% | −33.1% | −32.1% | −21.6% | −21.3% | −17.3% |
| Net income | −$26.0M | −$5.39M | −$9.40M | −$64.2M | −$90.2M | −$61.3M | −$69.2M | −$71.8M |
| Net margin | −40.9% | −5.2% | −6.2% | −31.1% | −32.2% | −17.5% | −16.2% | −13.5% |
| EPS (diluted) | −$1.00 | −$0.20 | −$0.20 | −$0.68 | −$0.91 | −$0.59 | −$0.63 | −$0.62 |
| Balance sheet | ||||||||
| Cash and equivalents | $177.9M | $39.1M | $164.5M | $68.3M | $45.6M | $84.8M | $49.9M | $75.8M |
| Total assets | — | $238.0M | $689.2M | $852.5M | $871.2M | $972.6M | $1.13B | $1.34B |
| Total liabilities | — | $95.6M | $135.3M | $213.9M | $246.4M | $293.4M | $356.4M | $453.9M |
| Shareholders' equity | −$38.7M | −$33.4M | $553.9M | $638.6M | $624.8M | $679.1M | $773.5M | $887.4M |
| Cash flow | ||||||||
| Operating cash flow | $8.56M | $10.0M | $29.5M | $27.9M | $21.4M | $74.2M | $110.9M | $145.7M |
| Capital expenditure | $2.08M | $1.80M | $3.52M | $4.23M | $4.33M | $1.98M | $3.14M | $3.46M |
| Free cash flow | $6.49M | $8.20M | $25.9M | $23.7M | $17.1M | $72.2M | $107.8M | $142.3M |
| Q3 FY24Sep 2024 | Q4 FY24†Dec 2024 | Q1 FY25Mar 2025 | Q2 FY25Jun 2025 | Q3 FY25Sep 2025 | Q4 FY25†Dec 2025 | Q1 FY26Mar 2026 | Q2 FY26Jun 2026 | |
|---|---|---|---|---|---|---|---|---|
| Income statement | ||||||||
| Revenue | $109.1M | $116.1M | $122.4M | $127.2M | $136.9M | $145.3M | $154.0M | $163.8M |
| Growth (year over year) | +23.0% | +19.3% | +22.0% | +23.5% | +25.5% | +25.2% | +25.8% | +28.7% |
| Gross profit | $81.8M | $87.6M | $92.2M | $97.0M | $106.0M | $113.1M | $120.4M | $127.6M |
| Gross margin | 75.0% | 75.4% | 75.3% | 76.3% | 77.4% | 77.9% | 78.2% | 77.9% |
| Operating income | −$29.9M | −$25.4M | −$23.0M | −$26.0M | −$21.6M | −$21.3M | −$12.9M | −$13.2M |
| Operating margin | −27.4% | −21.9% | −18.8% | −20.4% | −15.8% | −14.7% | −8.4% | −8.1% |
| Net income | −$22.9M | −$23.2M | −$18.5M | −$21.7M | −$16.4M | −$15.2M | −$8.27M | −$4.17M |
| Net margin | −21.0% | −20.0% | −15.1% | −17.0% | −12.0% | −10.5% | −5.4% | −2.5% |
| EPS (diluted) | −$0.21 | −$0.21 | −$0.16 | −$0.19 | −$0.14 | −$0.13 | −$0.07 | −$0.03 |
| Balance sheet | ||||||||
| Cash and equivalents | $62.2M | $49.9M | $44.4M | $51.3M | $78.4M | $75.8M | $61.0M | $96.7M |
| Total assets | $1.08B | $1.13B | $1.16B | $1.21B | $1.27B | $1.34B | $1.37B | $1.49B |
| Total liabilities | $324.7M | $356.4M | $356.2M | $381.7M | $406.1M | $453.9M | $449.2M | $528.6M |
| Shareholders' equity | $756.2M | $773.5M | $800.0M | $826.5M | $859.4M | $887.4M | $924.0M | $960.7M |
| Cash flow | ||||||||
| Operating cash flow | $27.6M | $49.1M | $28.8M | $36.1M | $30.2M | $50.7M | $38.4M | $57.1M |
| Capital expenditure | $936.0K | $634.0K | $647.0K | $627.0K | $1.35M | $840.0K | $1.07M | $3.31M |
| Free cash flow | $26.7M | $48.5M | $28.1M | $35.5M | $28.8M | $49.9M | $37.3M | $53.7M |
From JFrog's 10-K and 10-Q filings with the SEC; its fiscal year ends in December. Each period shows the latest figure the company has reported for it, including restatements. Net margin is our own calculation from those reported figures (net income ÷ revenue); it is left blank where revenue is zero or missing. † Quarter derived from the company's year-to-date or full-year totals. Filings on SEC EDGAR →
About JFrog
- Headquarters
- Sunnyvale, California From SEC filings, Oct 2026
Recent News (4)
-
Breakingviews - COMMENTARY: French investors face boiling frog test Breakingviews - COMMENTARY: French investors face boiling frog test Reuters
-
FROG® EverClean™ Brings Mineral Sanitizing to Every Pool on the Service Route Paired with FROG® Algae Blocker 4Pro, the mineral sanitizer simplifies pool care MINNETONKA, Minn., Oct. 13, 2026 /PRNewswire/ -- King Technology, maker of FROG® water care products, has launched FROG…
-
Analysts Offer Insights on Technology Companies: Zscaler (ZS), Salesforce (CRM) and JFrog (FROG) Analysts Offer Insights on Technology Companies: Zscaler (ZS), Salesforce (CRM) and JFrog (FROG) The Globe and Mail
-
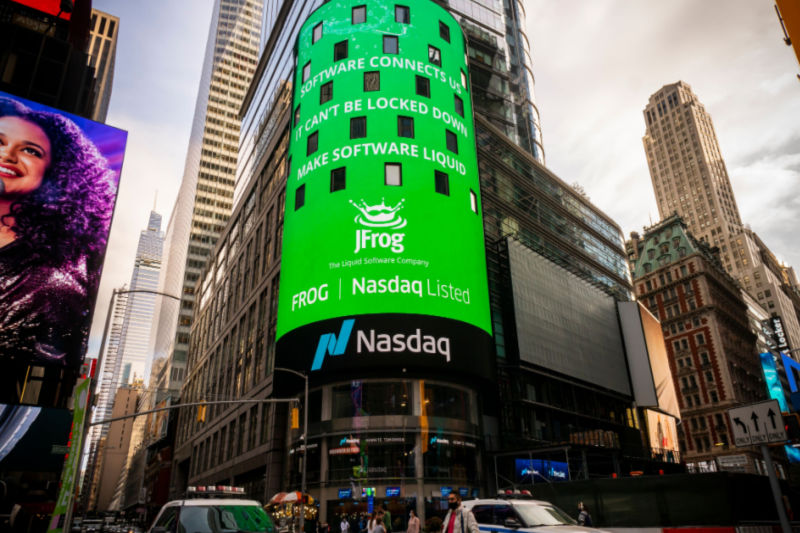 Morgan Stanley raises JFrog stock price target to $100 on cloud growth
More Information Technology stocks
- ALAB Astera Labs
- ARM Arm Holdings
- ASML ASML Holding
- MRVL Marvell Technology
- TWLO Twilio
- AAPL Apple Inc.
- ACN Accenture
- ADBE Adobe Inc.