
Key facts
- Market cap
- $73.69B $328.09 as of Oct 21, 2026, 9:45 PM EDT × 224.61M shares outstanding as of Jun 30, 2026, from the 10-Q cover page (SEC filings)
- P/E (trailing)
- 28.0 $328.09 as of Oct 21, 2026, 9:45 PM EDT ÷ diluted EPS of $11.72 for the four quarters to Jun 30, 2026, one of them a fourth quarter derived as the fiscal year less the first three
- EPS (trailing 12 months)
- $11.72 Diluted, the four quarters to Jun 30, 2026, one of them a fourth quarter derived as the fiscal year less the first three, summed, from SEC filings
- 52-week range (closes)
- $278.19 – $352.98 Lowest close Mar 19, 2026, highest Aug 24, 2026; 251 daily closes to Oct 20, 2026 from Dalsna Finance's price archive
- Fiscal year ends
- December Fiscal 2025 ended Dec 31, 2025, from SEC filings
- Dividend (latest fiscal year)
- $5.40 per share Declared in fiscal 2025 (ended Dec 31, 2025), from SEC filings
- In the S&P 500 since
- Mar 4, 1957 · All S&P 500 changes
Norfolk Southern (NSC) is trading up at $328.09 (+0.77%) on NYSE/NASDAQ, as of the latest quote. It is a S&P 500 constituent in the Industrials sector.
Norfolk Southern revenue & net income history (FY2016–FY2025)
| FY2016Dec 2016 | FY2017Dec 2017 | FY2018Dec 2018 | FY2019Dec 2019 | FY2020Dec 2020 | FY2021Dec 2021 | FY2022Dec 2022 | FY2023Dec 2023 | FY2024Dec 2024 | FY2025Dec 2025 | |
|---|---|---|---|---|---|---|---|---|---|---|
| Income statement | ||||||||||
| Revenue | $9.89B | $10.6B | $11.5B | $11.3B | $9.79B | $11.1B | $12.7B | $12.2B | $12.1B | $12.2B |
| Growth (year over year) | −5.9% | +6.7% | +8.6% | −1.4% | −13.3% | +13.8% | +14.4% | −4.6% | −0.3% | +0.5% |
| Operating income | $3.01B | $3.52B | $3.96B | $3.99B | $3.00B | $4.45B | $4.81B | $2.85B | $4.07B | $4.36B |
| Operating margin | 30.4% | 33.4% | 34.6% | 35.3% | 30.7% | 39.9% | 37.7% | 23.5% | 33.6% | 35.8% |
| Net income | $1.66B | $5.40B | $2.67B | $2.72B | $2.01B | $3.00B | $3.27B | $1.83B | $2.62B | $2.87B |
| Net margin | 16.8% | 51.2% | 23.3% | 24.1% | 20.6% | 27.0% | 25.7% | 15.0% | 21.6% | 23.6% |
| EPS (diluted) | $5.62 | $18.61 | $9.51 | $10.25 | $7.84 | $12.11 | $13.88 | $8.02 | $11.57 | $12.75 |
| Balance sheet | ||||||||||
| Cash and equivalents | $956.0M | $690.0M | $358.0M | $580.0M | $1.11B | $839.0M | $456.0M | $1.57B | $1.64B | $1.53B |
| Total assets | $34.9B | $35.7B | $36.2B | $37.9B | $38.0B | $38.5B | $38.9B | $41.7B | $43.7B | $45.2B |
| Total liabilities | $22.5B | $19.4B | $20.9B | $22.7B | $23.2B | $24.9B | $26.2B | $28.9B | $29.4B | $29.7B |
| Long-term debt | $9.56B | $9.14B | $10.6B | $11.9B | $12.1B | $13.3B | $14.5B | $17.2B | $16.7B | $16.5B |
| Shareholders' equity | $12.4B | $16.4B | $15.4B | $15.2B | $14.8B | $13.6B | $12.7B | $12.8B | $14.3B | $15.5B |
| Cash flow | ||||||||||
| Operating cash flow | $3.03B | $3.25B | $3.73B | $3.89B | $3.64B | $4.25B | $4.22B | $3.18B | $4.05B | $4.36B |
| Capital expenditure | $1.89B | $1.72B | $1.95B | $2.02B | $1.49B | $1.47B | $1.95B | $2.33B | $2.38B | $2.20B |
| Free cash flow | $1.15B | $1.53B | $1.77B | $1.87B | $2.14B | $2.79B | $2.27B | $852.0M | $1.67B | $2.16B |
| Dividends paid | $695.0M | $703.0M | $844.0M | $949.0M | $960.0M | $1.03B | $1.17B | $1.23B | $1.22B | $1.22B |
| Share buybacks | $803.0M | $1.01B | $2.78B | $2.10B | $1.44B | $3.39B | $3.11B | $622.0M | $0 | $534.0M |
| Q3 FY24Sep 2024 | Q4 FY24†Dec 2024 | Q1 FY25Mar 2025 | Q2 FY25Jun 2025 | Q3 FY25Sep 2025 | Q4 FY25†Dec 2025 | Q1 FY26Mar 2026 | Q2 FY26Jun 2026 | |
|---|---|---|---|---|---|---|---|---|
| Income statement | ||||||||
| Revenue | $3.05B | $3.02B | $2.99B | $3.11B | $3.10B | $2.97B | $3.00B | $3.46B |
| Growth (year over year) | +2.7% | −1.6% | −0.4% | +2.2% | +1.7% | −1.7% | +0.2% | +11.4% |
| Operating income | $1.60B | $1.13B | $1.15B | $1.18B | $1.10B | $937.0M | $877.0M | $1.12B |
| Operating margin | 52.3% | 37.4% | 38.3% | 37.8% | 35.4% | 31.5% | 29.3% | 32.4% |
| Net income | $1.10B | $733.0M | $750.0M | $768.0M | $711.0M | $644.0M | $547.0M | $734.0M |
| Net margin | 36.0% | 24.2% | 25.1% | 24.7% | 22.9% | 21.7% | 18.2% | 21.2% |
| EPS (diluted) | $4.85 | $3.24 | $3.31 | $3.41 | $3.16 | $2.87 | $2.43 | $3.26 |
| Balance sheet | ||||||||
| Cash and equivalents | $975.0M | $1.64B | $1.01B | $1.30B | $1.42B | $1.53B | $1.34B | $1.07B |
| Total assets | $43.3B | $43.7B | $43.8B | $44.2B | $44.6B | $45.2B | $45.1B | $45.1B |
| Total liabilities | $29.5B | $29.4B | $29.3B | $29.4B | $29.4B | $29.7B | $29.3B | $28.9B |
| Long-term debt | $16.6B | $16.7B | $16.7B | $16.5B | $16.5B | $16.5B | $16.5B | $16.0B |
| Shareholders' equity | $13.8B | $14.3B | $14.5B | $14.8B | $15.1B | $15.5B | $15.8B | $16.3B |
| Cash flow | ||||||||
| Operating cash flow | $1.23B | $951.0M | $950.0M | $1.08B | $1.27B | $1.06B | $344.0M | $1.05B |
| Capital expenditure | $581.0M | $675.0M | $449.0M | $475.0M | $551.0M | $729.0M | $382.0M | $439.0M |
| Free cash flow | $645.0M | $276.0M | $501.0M | $602.0M | $720.0M | $334.0M | −$38.0M | $615.0M |
| Dividends paid | $305.0M | $306.0M | $306.0M | $303.0M | $303.0M | $303.0M | $303.0M | $303.0M |
| Share buybacks | $0 | $0 | $248.0M | $208.0M | $78.0M | $0 | $5.00M | $0 |
From Norfolk Southern's 10-K and 10-Q filings with the SEC; its fiscal year ends in December. Each period shows the latest figure the company has reported for it, including restatements. Net margin is our own calculation from those reported figures (net income ÷ revenue); it is left blank where revenue is zero or missing. † Quarter derived from the company's year-to-date or full-year totals. Filings on SEC EDGAR →
Norfolk Southern vs the Industrials sector and the S&P 500
Norfolk Southern's latest reported figures next to the median of the other 81 S&P 500 Industrials companies and of the other 502 S&P 500 companies; each median is taken over the companies with a comparable figure (counts in the footnote). A median is the middle value, not an average, so one very large company does not move it.
| Measure | Norfolk Southern | Industrials (81 other S&P 500 companies) | S&P 500 (502 other companies) |
|---|---|---|---|
| Revenue growth, latest fiscal year | +0.5% | +4.6% | +7.0% |
| Net margin, latest fiscal year | 23.6% | 11.2% | 12.9% |
| Dividend per share, latest fiscal year | $5.40 | $2.49 | $2.40 |
| Share price change, 1 year | +12.7% | +6.6% | +6.8% |
Norfolk Southern: fiscal year ended December 2025, from its 10-K and 10-Q filings with the SEC. Medians computed October 21, 2026 from each company's latest annual filing (fiscal years ending between July 2025 and September 2026) and our price archive. Prices for every company, Norfolk Southern included, were fetched between 10:06 and 10:15 ET on October 21, 2026; the 1-year change compares that price with each company's last close on or before October 21, 2025. Net margin and price change are our calculations from reported figures. Each median counts only the companies with a comparable figure (sector / S&P 500): revenue growth 79/496, net margin 79/496, dividend per share 63/349, 1-year price change 78/490; the reasons below can overlap. 12 are left out of the price figure because our archive holds no comparable close for them; dividend medians are among the 63 sector and 349 S&P 500 companies reporting a per-share dividend. The S&P 500 price figure is the middle company's change, not the index's return.
About Norfolk Southern
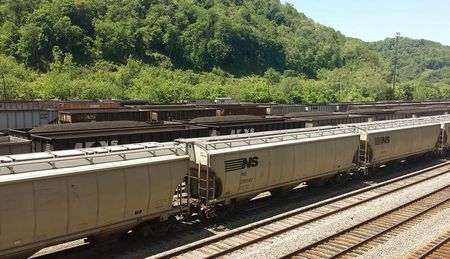
The Norfolk Southern Railway is a Class I freight railroad operating in the Eastern United States. Headquartered in Atlanta, the company was formed in 1982 with the merger of the Norfolk and Western Railway and Southern Railway. The company operates 19,420 route miles (31,250 km) in 22 eastern states and the District of Columbia, and has rights in Canada over the Albany to Montreal route of the Canadian Pacific Kansas City. Norfolk Southern Railway is the leading subsidiary of the Norfolk Southern Corporation.
Source: Wikipedia — Norfolk Southern Railway
- Headquarters
- Atlanta, Georgia From SEC filings, Oct 2026
Recent News (20)
-
Norfolk Southern to announce third quarter 2026 earnings results on October 22, 2026 ATLANTA, Oct. 2, 2026 /PRNewswire/ -- Norfolk Southern Corporation (NYSE: NSC) will announce its third quarter 2026 financial results during a live conference call and internet webcast at 10:00 a.m. E…
-
More Than 500 Customers Back Union Pacific-Norfolk Southern Combination as a Catalyst for American Growth Shippers Across U.S. Industries Cite Expanded Market Access, Stronger Supply Chains and New Growth Opportunities as the Combination's Key Benefits OMAHA, Neb. and ATLANTA, Sept. 16, 2026 /PRNewswire/ …
-
Norfolk Southern sees fuel prices weighing on third quarter despite freight share gains Norfolk Southern sees fuel prices weighing on third quarter despite freight share gains Reuters
-
 Norfolk Southern sees fuel prices weighing on third quarter despite freight share gains
-
-
MSA Safety to Showcase Comprehensive Worker Safety Solutions at NSC 2026 Highlights include connected gas detection, market-leading head protection and trusted fall protection designed to help improve safety, compliance and productivity INDIANAPOLIS, Sept. 14, 2026 /PRNews…
-
-
-
 Is Norfolk Southern Stock Underperforming the Nasdaq?
-
Turning Safety and Wellbeing into a Competitive Edge: Wellness Workdays CEO and Founder to Speak at NSC Safety Congress & Expo BOSTON, Sept. 3, 2026 /PRNewswire/ -- Wellness Workdays, a leading provider of workplace wellness solutions, is proud to announce that its CEO and Founder, Debra Wein, will speak at the National Safet…
-
 Union Pacific Sees Norfolk Southern Merger Closing by Late 2027 as STB Review Advances
-
Seven State Attorneys General Raise Concerns Over Proposed Union Pacific-Norfolk Southern Rail Merger The letter underscores the importance of rail competition and affordable transportation costs for American farmers – issues at the center of an ongoing antitrust lawsuit filed by 13 Kansas- and Colora…
-
 Union Pacific (UNP) is Winning the Railroad Race. Can Norfolk Southern (NSC) Catch Up through the Merger?
-
-
 Do Wall Street Analysts Like Norfolk Southern Stock?
-
 Union Pacific (UNP) Reported a $91M Fuel Surcharge Surplus. Could That Hurt its Norfolk Southern Deal?
-
Wall Street Says Hold but Hedge Funds Are Circling NSC’s $85 Billion Merger Wall Street Says Hold but Hedge Funds Are Circling NSC’s $85 Billion Merger
-
 Form 4 Norfolk Southern Corporation For: 29 July
-
UNP vs. NSC: One Is a Growth Play, the Other a Merger Bet UNP vs. NSC: One Is a Growth Play, the Other a Merger Bet
-
Norfolk Southern Posts Record Revenue as Freight Demand Strengthens Norfolk Southern Posts Record Revenue as Freight Demand Strengthens
More Industrials stocks
- MAS Masco
- MMM 3M
- NDSN Nordson Corporation
- NOC Northrop Grumman
- ODFL Old Dominion
- OTIS Otis Worldwide
- PAYX Paychex
- PCAR Paccar